
Welcome to the Silver State
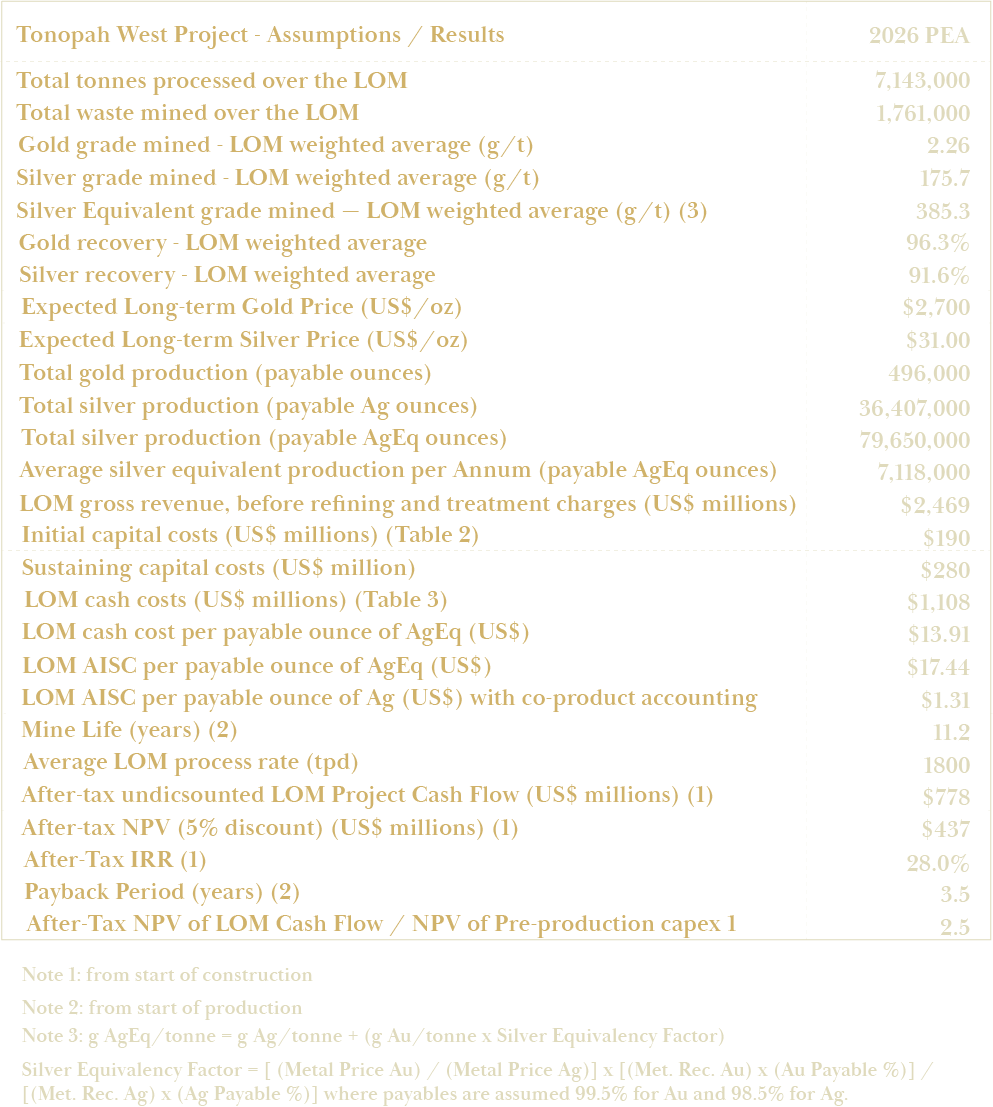
Blackrock is the first group to target unmined vein extensions starting from the historic workings on the property since production shut down nearly 100 years ago, drilling out 100 million silver equivalent ounces, and showing new life for this storied district. A 2026 Updated Preliminary Economic Assessment (PEA)* outlines an average annual production profile of 7.1 million silver equivalent ounces per year at an all-in sustaining cost of USD$17.44 per AgEq ounce over an 11.2 year mine life. The project currently hosts an indicated mineral resource estimate of 2.75 million tonnes at a block diluted grade of 216.8 grams per tonne (g/t) silver (Ag) and 2.25 g/t gold (Au) for a total of 19,167,000 ounces of silver and 199,000 ounces of gold. In addition, the project currently hosts an inferred mineral resource of 5.5 million tonnes at a block diluted grade of 188.5 g/t Ag and 2.62 g/t Au for a total of 33,560,000 ounces of silver and 467,000 ounces of gold.
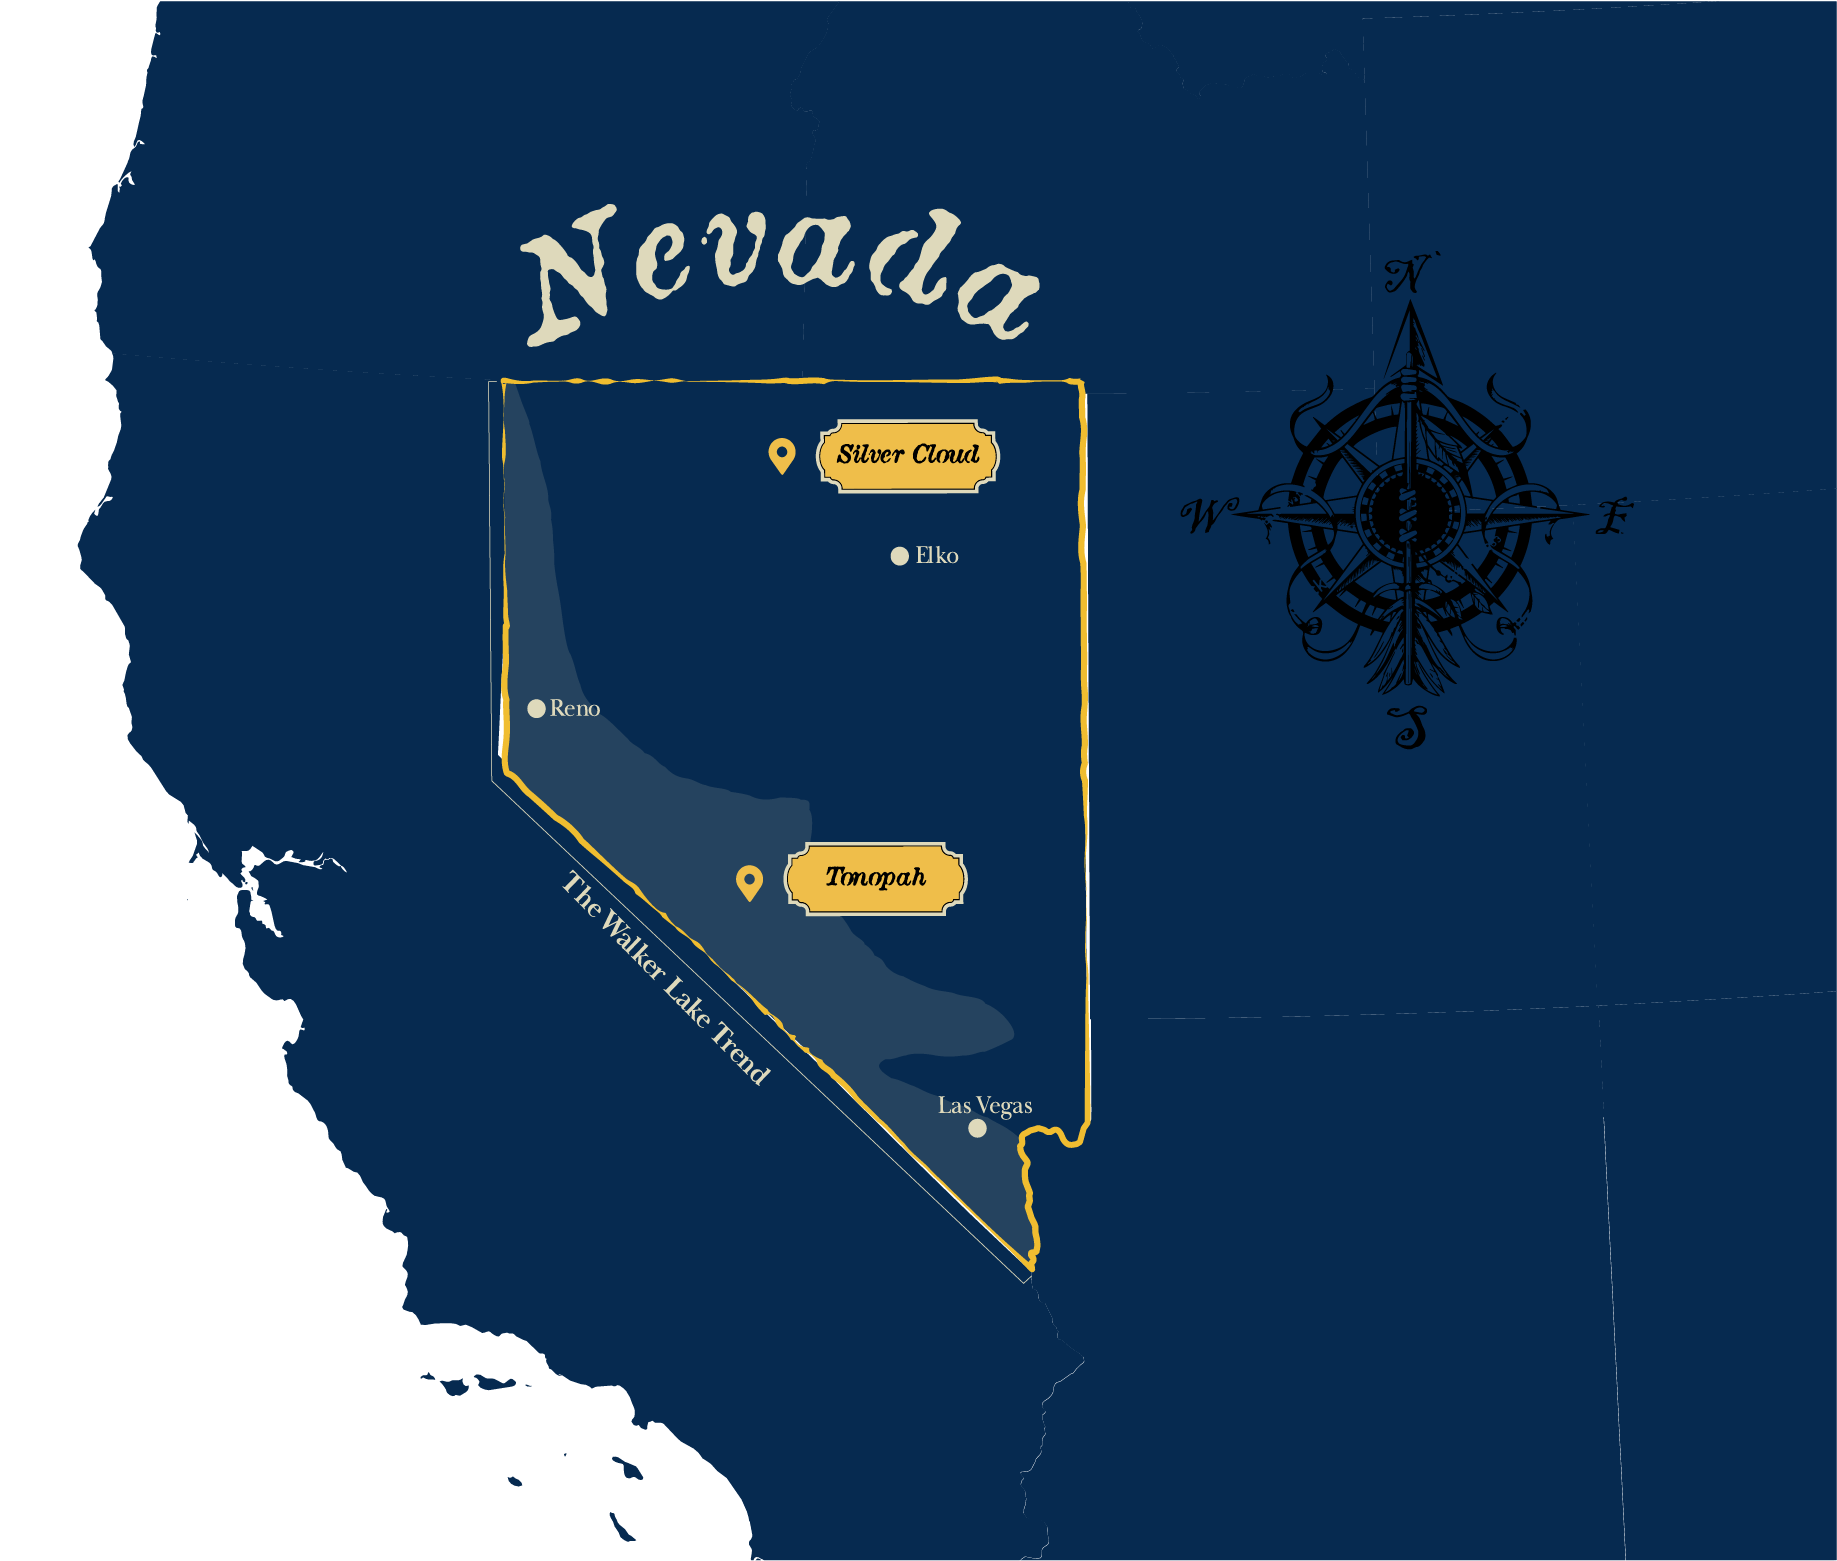
Blackrock’s flagship Tonopah West project consolidates the western half of the famed Tonopah Silver District within the Walker Lane trend of Nevada. Known as the Queen of the Silver Camps, the Tonopah Silver District produced over 174 million ounces of silver and 1.8 million ounces of gold from approximately 7.5 million tonnes of material, making it the second largest historic silver district within the “Silver State” of Nevada behind the Comstock Lode.
Low-Intermediate Sulfidation Epithermal Gold & Silver Veins
* Technical information relating to the Tonopah West Project is based on and derived from Blackrock’s press release titled “Blackrock Silver Announces Updated Preliminary Economic Assessment For Its Tonopah West Project In Nevada; +10 Year Mine Life Fortified By 90% Increase In Indicated Mineral Resources” dated March 31, 2026. Details of the updated preliminary economic assessment with an effective date of January 4, 2026 (the “PEA”) on the Tonopah West Project and the updated mineral resource estimate on the Tonopah West Project with an effective date of January 4, 2026 (the “MRE”) will be provided in a technical report prepared in accordance with National Instrument 43-101 – Standards of Disclosure for Mineral Projects to be filed on SEDAR+ and the this website within 45 days of March 31, 2026. The PEA is preliminary in nature and includes inferred mineral resources that are considered too speculative, geologically, to have the economic considerations applied to them to be categorized as mineral reserves. There is no certainty that the PEA will be realized. Mineral resources that are not mineral reserves do not have demonstrated economic viability.
| Cut-off Grade (AgEq g/t) (1) | Tonnes (kt) | Grade | Contained Metal | Classification(4) | ||||
|---|---|---|---|---|---|---|---|---|
| Au (g/t) | Ag (g/t) | AgEq (g/t)(2) | Au (koz) | Ag (koz) | AgEq (koz)(3) | |||
| 140 | 2,750 | 2.25 | 216.8 | 454.3 | 199 | 19,167 | 40,159 | Indicated |
| 140 | 5,538 | 2.62 | 188.5 | 465.8 | 467 | 33,560 | 82,944 | Inferred |
1 AgEq cutoff grade is based on total mining, processing and G&A costs of US$128.6/tonne and a silver price of US$34/ounce.
2 For non-Victor areas, the AgEq grade ratio used is 108:1 based on silver and gold prices of US$35/ounce and US$3,500/ounce, respectively, and recoveries for silver and gold of 88% and 95%, respectively. For the Victor area, the Silver Equivalent grade ratio used is 102:1 based on silver and gold prices of US$35/ounce and US$3,500/ounce, respectively, and recoveries for silver and gold of 96% and 98%, respectively. AgEq Factor= (Ag Price / Au Price) x (Ag Rec / Au Rec); g AgEq/t = g Ag/t + (g Au/t / AgEq Factor).
3 Rounding as required by reporting guidelines may result in apparent discrepancies between tonnes, grade, and contained metal content.
4 Mineral resources are not mineral reserves and do not have demonstrated economic viability. There is no certainty that all or any part of the mineral resources estimated will be converted into mineral reserves. The quantity and grade of reported inferred mineral resources in this estimation are uncertain in nature and there has been insufficient exploration to define these inferred mineral resources as indicated mineral resources. It is uncertain if further exploration will result in upgrading them to the Indicated mineral resources category.
The MRE encompasses the spatial areas known as Victor, DPB North, DPB South, Northwest Step Out, and the East Extension areas. The Victor area is approximately 700-metres by 350-metres while the DPB area is 700-metres by 1,100-metres. NW Step Out represents a new extension of the vein zones to west-northwest. The East Extension is an area between the DPB South area and the eastern edge of the property. The spatial areas are not considered to be significantly different geologically but have been separated for logistical purposes in future mining scenarios. Table 7 presents the mineral resources subdivided by spatial area.
Amalgamation of West End Mining Company and Tonopah Extension Mining Company.
Excellent Metallurgy with recoveries of 96.1% for gold and 88.9% for silver from a 3-stage crushing circuit and processing plant*

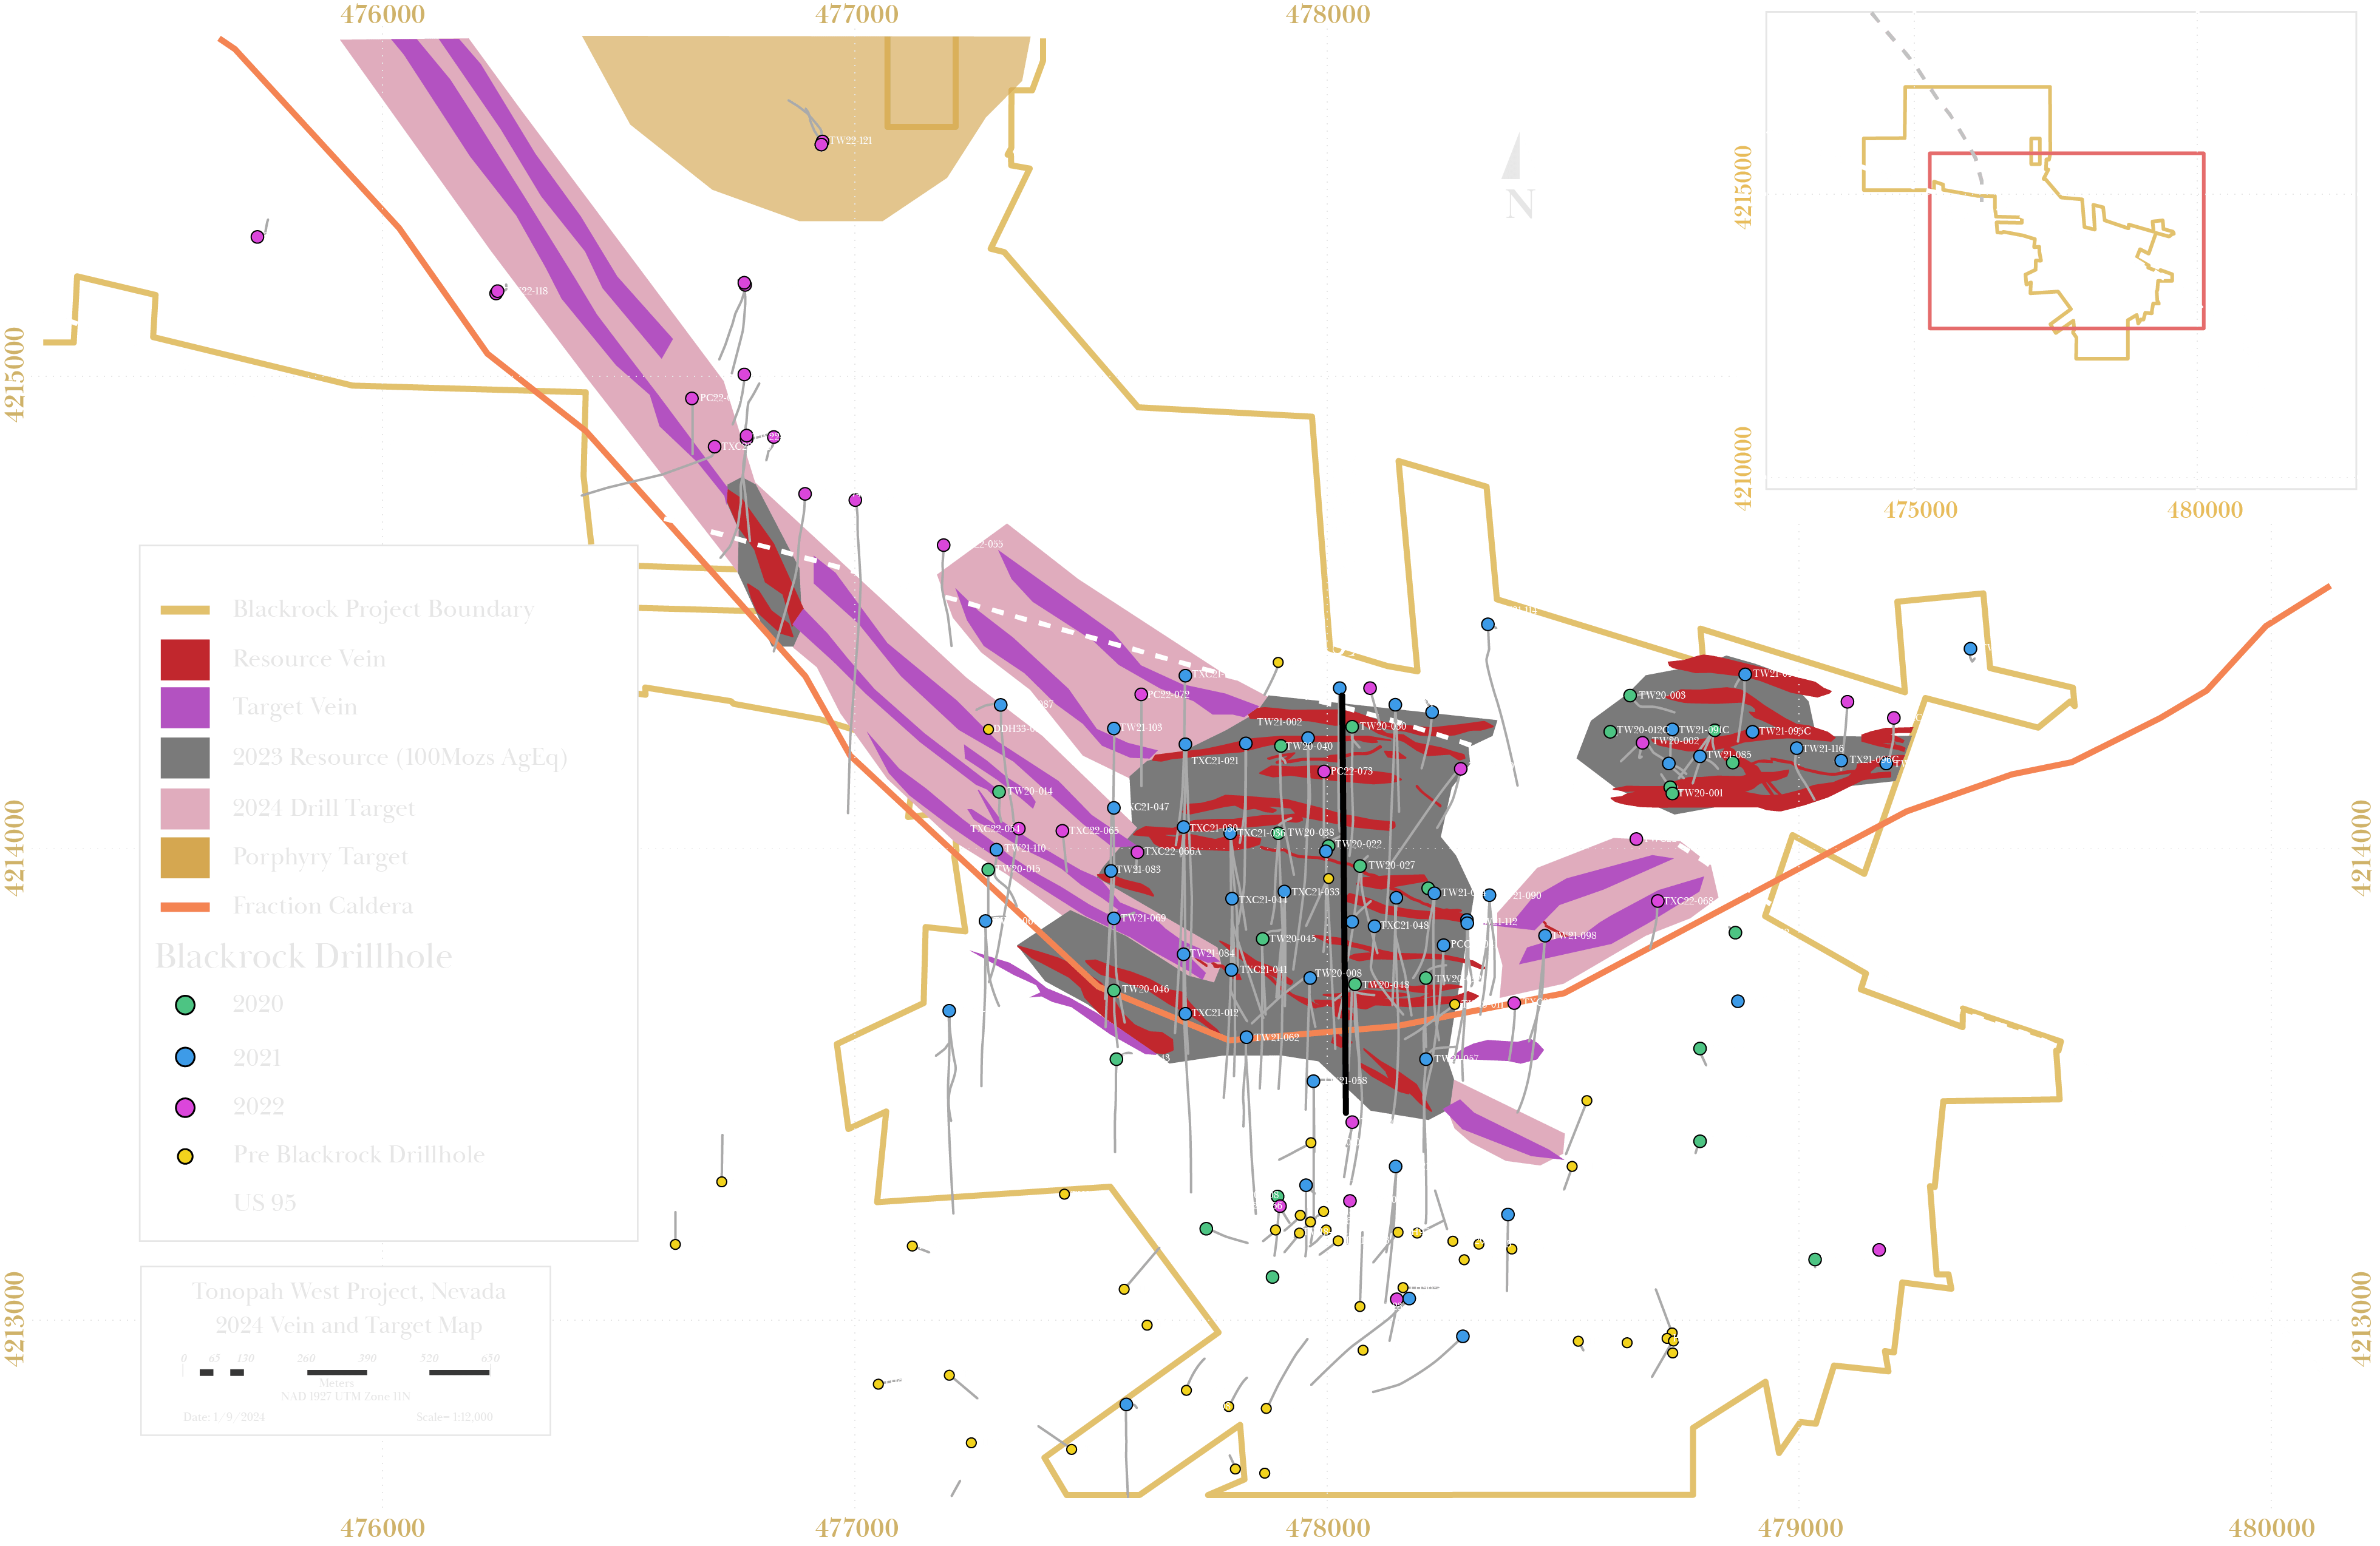
Multiple high-grade quartz vein swarm trending east-west to northwest.
System is open to the northwest with multiple new high-grade intercepts 1 km away.
Click image to expand
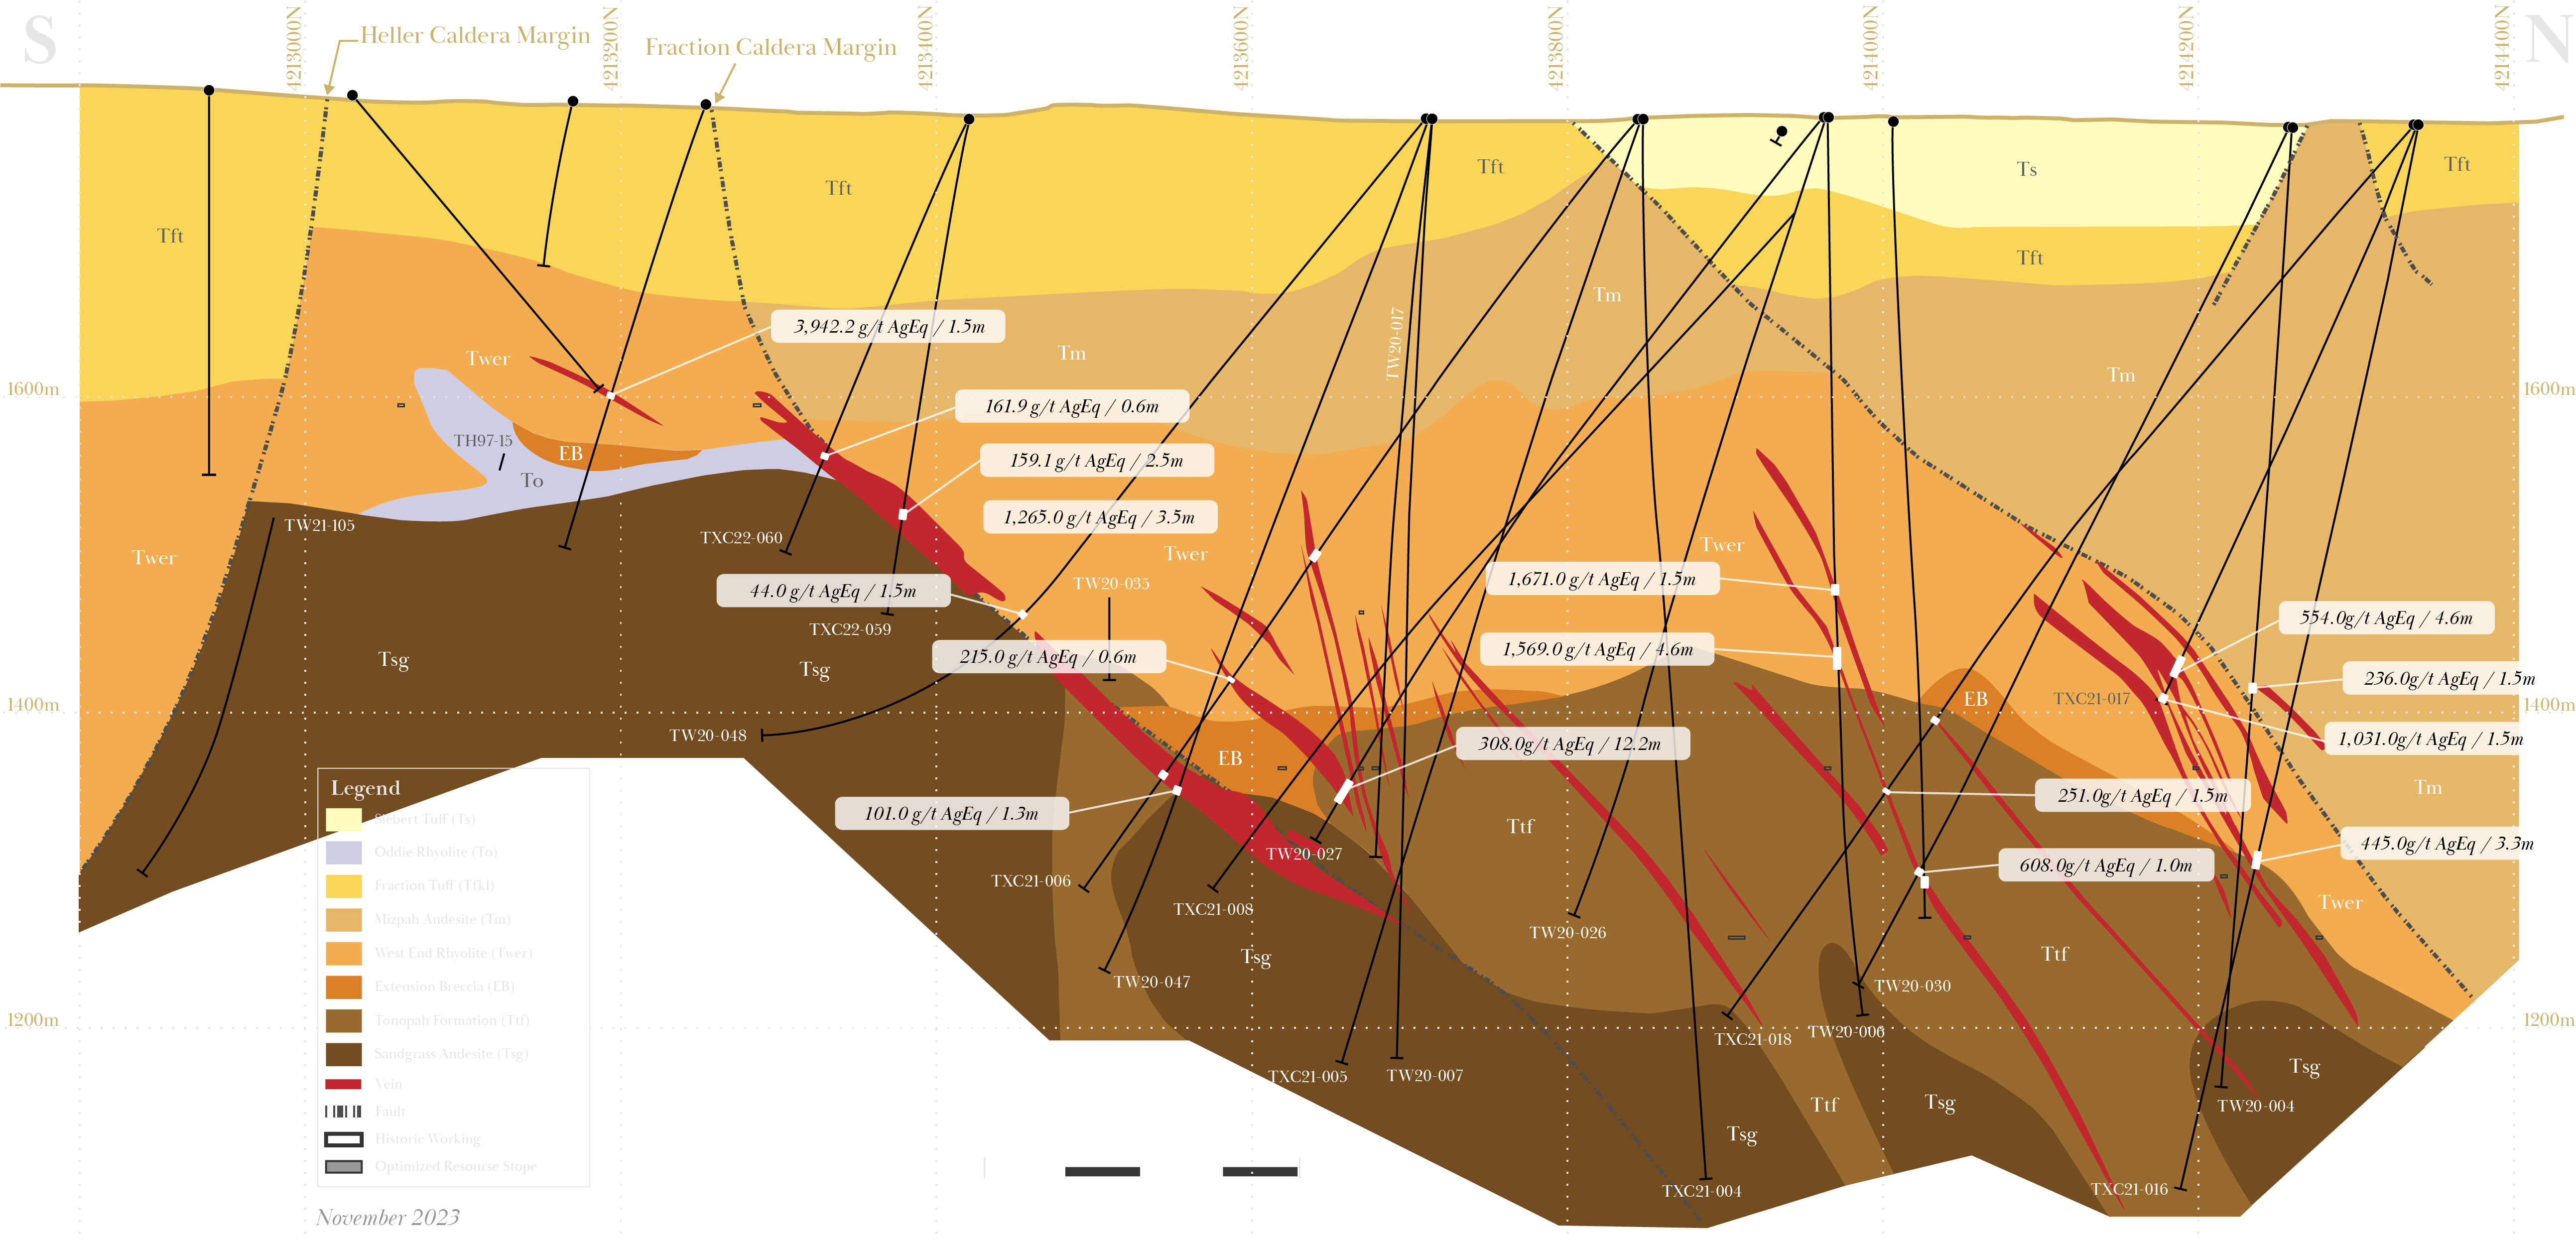
Silver Equivalent grade is based on silver and gold prices of US$20/ounce and US$1750/ounce,
respectively, and recoveries for silver and gold of 87% and 95%, respectively
Click image to expand
I, Jeffrey Bickel, C.P.G. (AIPG) and Registered Geologist (Arizona), consent to the public filing of the technical report titled “Technical Report for Updated Estimate of Mineral Resources, Tonopah West Silver-Gold Project, Nye and Esmeralda Counties, Nevada, USA”, with an effective date of October 6, 2023 and dated November 8, 2023 (the “Technical Report”) prepared for Blackrock Silver Corp. (the “Company”).
I also consent to any extracts from or a summary of the Technical Report in the news releases of the Company dated October 10, 2023 and November 8, 2023 (collectively, the “News Releases”).
I certify that I have read the News Releases filed by the Company and that they fairly and accurately represent the information in the Technical Report.
Dated this 8th day of November, 2023
“Jeffrey Bickel”//Sealed and Stamped
Jeffrey Bickel, C.P.G. (#12050)
