Welcome to The
Silver State
Fraser Institute Annual Survey of Mining Companies 2025, Nevada has reclaimed the #1 spot as the most attractive mining jurisdiction in the world (Investment Attractiveness Index).
Tonopah West represents the largest patented claim package in the Tonopah Silver district, 100 patented and 279 unpatented claims covering 25.5 km2.
Tonopah Silver District: One of the largest historic silver districts in North America, producing 174 Mozs Ag & 1.8 Mozs Au from 7.5m tonnes
Mined from underground from 1900 to 1930, with peak years producing up to 14,000,000oz/ year AgEq; Victor vein was 24m thick where production ceased
A 2026 Updated Preliminary Economic Assessment (PEA)* outlines an average annual production profile of 7.1 million silver equivalent ounces per year at an all-in sustaining cost of USD$17.44 per AgEq ounce over an 11.2 year mine life.
The project currently hosts an indicated mineral resource estimate of 2.75 million tonnes at a block diluted grade of 216.8 grams per tonne (g/t) silver (Ag) and 2.25 g/t gold (Au) for a total of 19,167,000 ounces of silver and 199,000 ounces of gold. In addition, the project currently hosts an inferred mineral resource of 5.5 million tonnes at a block diluted grade of 188.5 g/t Ag and 2.62 g/t Au for a total of 33,560,000 ounces of silver and 467,000 ounces of gold.

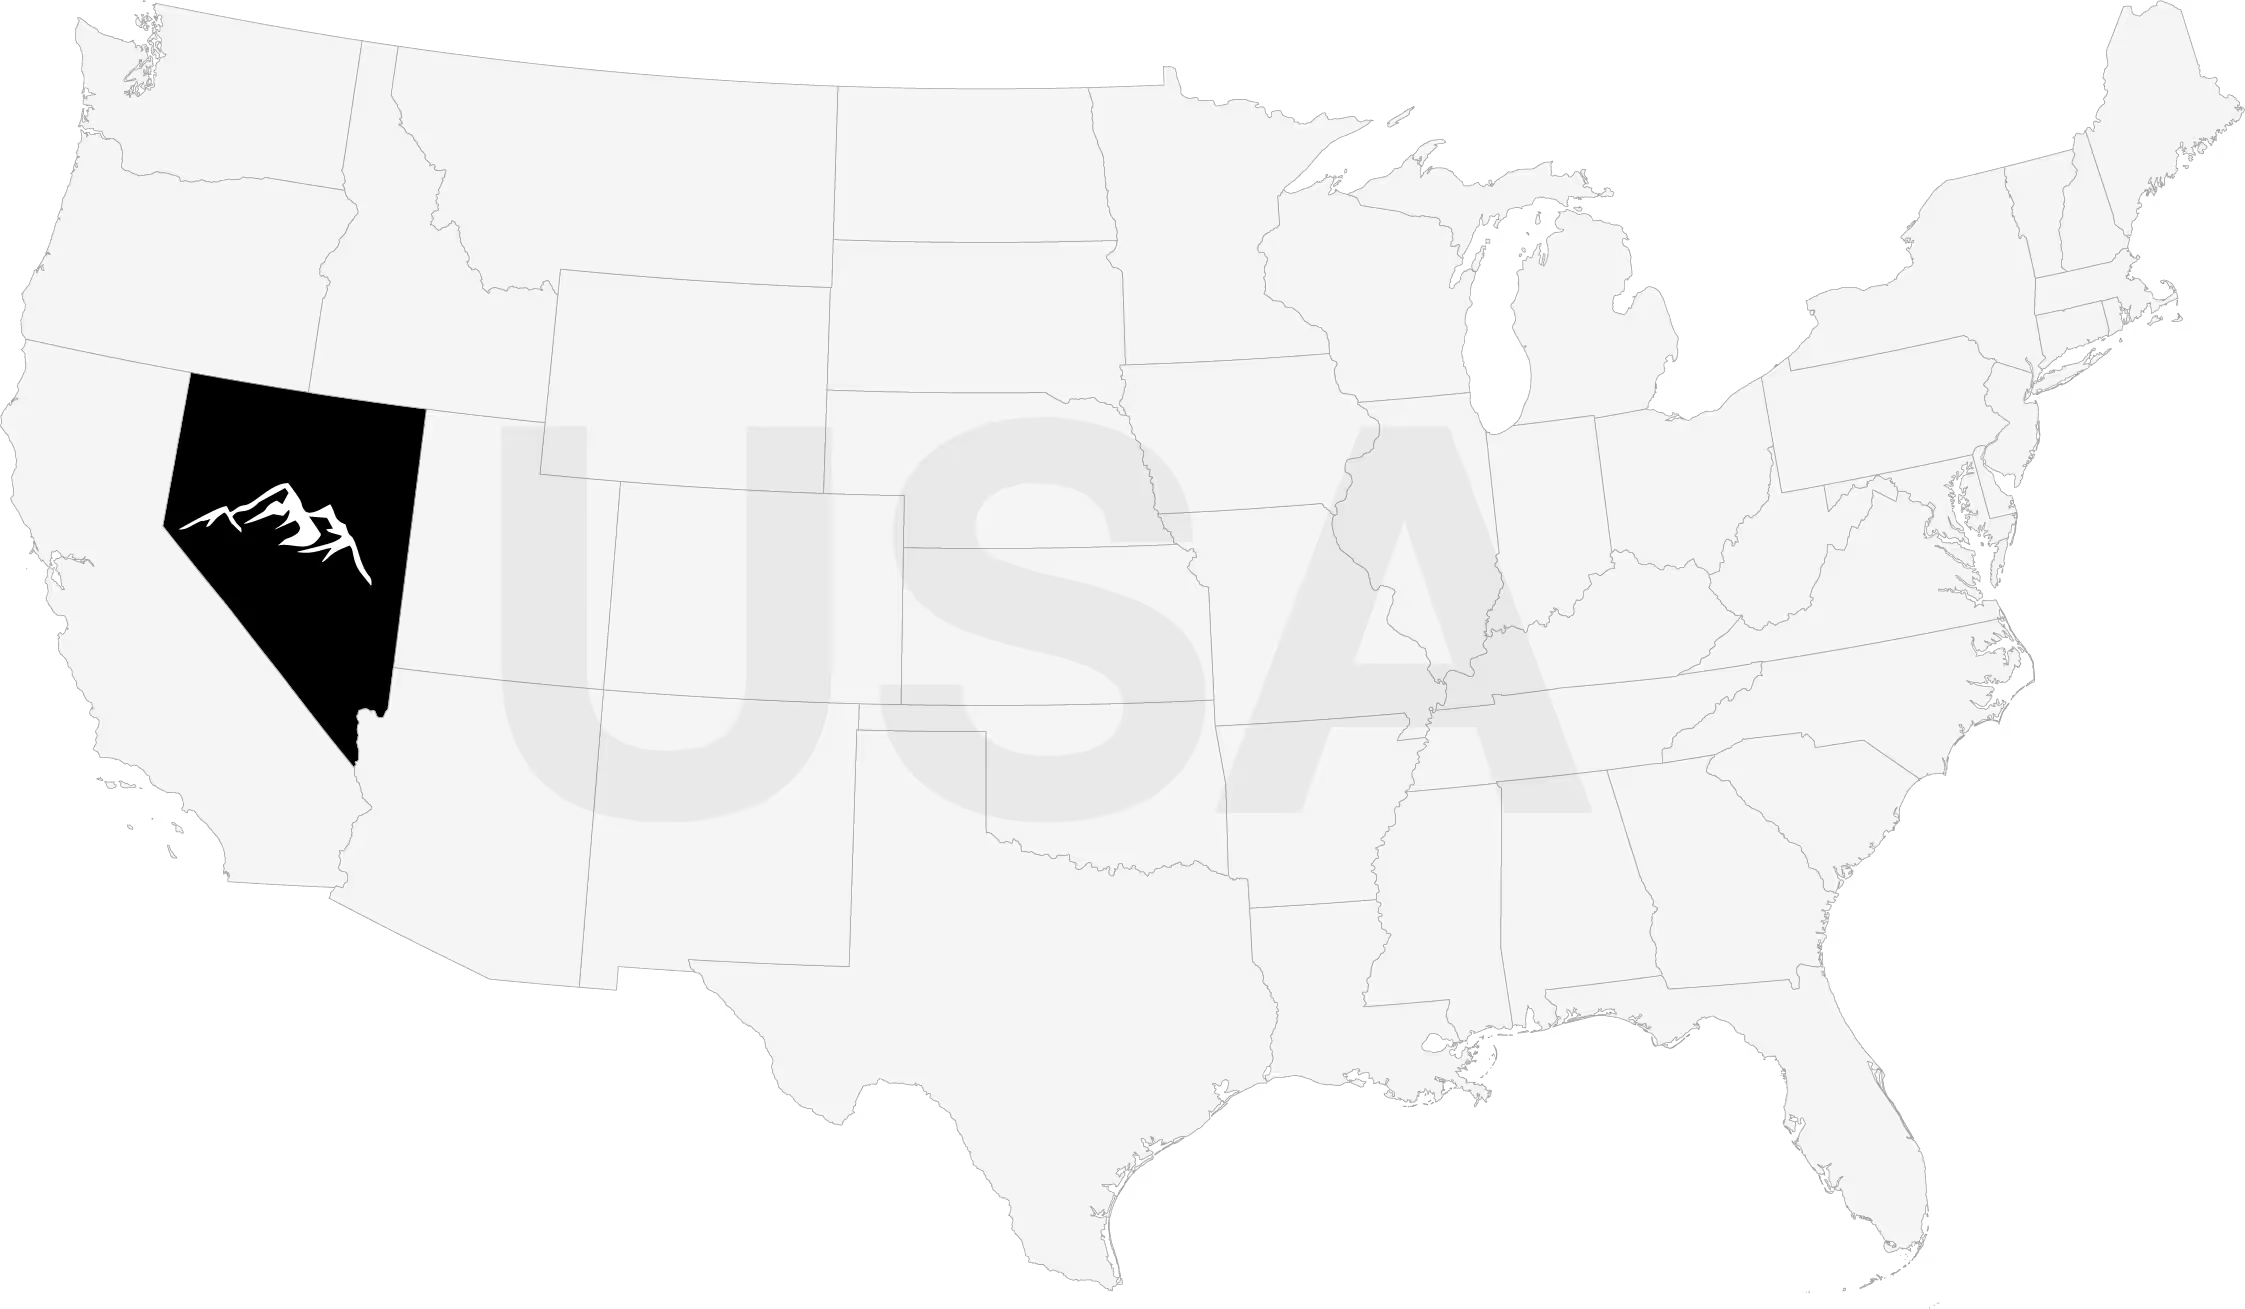
#1 Mining Jurisdiction
in the World
Nevada has reclaimed the #1 spot as the most attractive mining jurisdiction in the world (Fraser Institute Annual Survey of Mining Companies 2025), combining exceptional geologic mineral potential with highly favorable government policies.
Tonopah West represents the largest patented claim package in the Tonopah Silver District, comprising 100 patented and 279 unpatented claims covering 25.5 km².
Known as the Queen of the Silver Camps, the Tonopah Silver District is one of the largest historic silver districts in North America, having produced 174 Moz Ag and 1.8 Moz Au from 7.5 million tonnes.
Mining ran from 1900 to 1930, with peak years reaching up to 14,000,000 oz/year AgEq — and the Victor vein was still 24m thick where production ceased.
Primary Silver Asset in America
Critical Mineral Status:
Essential to economic and national security of the United States
De-risking Towards Development
Nevada – Private – Patented Land - Fast Tracked Permitting Advantages
Upside Case & Catalysts
to upside metal prices
Exploration & Resource Expansion Drilling Fast Tracked Permitting
2026 Preliminary Economic Assessment (PEA)
$437M
AFTER-TAX NPV (5%)
Based on $31 Ag / $2,700 Au
28%
AFTER-TAX IRR
Strong project economics at base case pricing
$190M
INITIAL CAPEX
Estimated development capital
$17.44/oz AgEq
ALL-IN SUSTAINING COST (AISC)
Per ounce of silver equivalent
7.1M oz
AVERAGE ANNUAL PRODUCTION
Average silver equivalent production per year
(payable AgEq ounces)
11.2 years
MINE LIFE
Includes 271 g/t silver and 3.34 g/t gold
79.65M AgEq Payable Ounces
TOTAL PAYABLE SILVER PRODUCTION
of 36,407,000 and 496,000 ounces of gold through LOM

2026 Mineral
Resource Estimate
*Technical information relating to the Tonopah West Project is based on and derived from the technical report prepared for Blackrock in accordance with National Instrument 43-101 – Standards of Disclosure for Mineral Projects entitled “Updated Preliminary Economic Assessment of Mineral Resource Estimate – Tonopah-West Silver-Gold Project, Nye and Esmeralda Counties, Nevada, USA” effective March 25, 2026 and dated May 12, 2026, which includes an updated preliminary economic assessment on the Tonopah West Project with an effective date of March 25, 2026 (the “PEA”) and an updated mineral resource estimate on the Tonopah West Project with an effective date of January 4, 2026 (the “MRE”). The PEA is preliminary in nature and includes inferred mineral resources that are considered too speculative, geologically, to have the economic considerations applied to them to be categorized as mineral reserves. There is no certainty that the PEA will be realized. Mineral resources that are not mineral reserves do not have demonstrated economic viability. Silver Equivalent (AgEq) Disclosure: In accordance with the NI 43-101 Technical Report filed May 12, 2026, silver equivalency is calculated using the following methodology: For non-Victor areas, the AgEq grade ratio used is 108:1 based on silver and gold prices of US$35/ounce and US$3,500/ounce, respectively, and recoveries for silver and gold of 88% and 95%, respectively. For the Victor area, the Silver Equivalent grade ratio used is 102:1 based on silver and gold prices of US$35/ounce and US$3,500/ounce, respectively, and recoveries for silver and gold of 96% and 98%, respectively. AgEq Factor= (Ag Price / Au Price) x (Ag Rec / Au Rec); g AgEq/t = g Ag/t + (g Au/t / AgEq Factor).
*Technical information relating to the Tonopah West Project is based on and derived from the technical report prepared for Blackrock in accordance with National Instrument 43-101 – Standards of Disclosure for Mineral Projects entitled “Updated Preliminary Economic Assessment of Mineral Resource Estimate – Tonopah-West Silver-Gold Project, Nye and Esmeralda Counties, Nevada, USA” effective March 25, 2026 and dated May 12, 2026, which includes an updated preliminary economic assessment on the Tonopah West Project with an effective date of March 25, 2026 (the “PEA”) and an updated mineral resource estimate on the Tonopah West Project with an effective date of January 4, 2026 (the “MRE”). The PEA is preliminary in nature and includes inferred mineral resources that are considered too speculative, geologically, to have the economic considerations applied to them to be categorized as mineral reserves. There is no certainty that the PEA will be realized. Mineral resources that are not mineral reserves do not have demonstrated economic viability. Silver Equivalent (AgEq) Disclosure: In accordance with the NI 43-101 Technical Report filed May 12, 2026, silver equivalency is calculated using the following methodology: For non-Victor areas, the AgEq grade ratio used is 108:1 based on silver and gold prices of US$35/ounce and US$3,500/ounce, respectively, and recoveries for silver and gold of 88% and 95%, respectively. For the Victor area, the Silver Equivalent grade ratio used is 102:1 based on silver and gold prices of US$35/ounce and US$3,500/ounce, respectively, and recoveries for silver and gold of 96% and 98%, respectively. AgEq Factor= (Ag Price / Au Price) x (Ag Rec / Au Rec); g AgEq/t = g Ag/t + (g Au/t / AgEq Factor).
1. AgEq cutoff grade is based on total mining, processing and G&A costs of $128.6/tonne and a silver price of $34/ounce.
2. For non-Victor areas a Silver Equivalent grade ratio used is 108:1 based on silver and gold prices of $35/ounce and $3,500/ounce, respectively, and recoveries for silver and gold of 88% and 95%, respectively. For the Victor area, Silver Equivalent grade ratio used is 102:1 based on silver and gold prices of $35/ounce and $3,500/ounce, respectively, and recoveries for silver and gold of 96% and 98%, respectively. AgEq Factor= (Ag Price / Au Price) x (Ag Rec / Au Rec); g AgEq/t = g Ag/t + (g Au/t / AgEq Factor).
3. Rounding as required by reporting guidelines may result in apparent discrepancies between tonnes, grade, and contained metal content.
4. Mineral resources are not mineral reserves and do not have demonstrated economic viability. There is no certainty that all or any part of the mineral resources estimated will be converted into mineral reserves. The quantity and grade of reported Inferred mineral resources in this estimation are uncertain in nature and there has been insufficient exploration to define these Inferred mineral resources as Indicated mineral resources. It is uncertain if further exploration will result in upgrading them to the Indicated mineral resources category.
Project Timeline

2026
2027
2028
Q1
Q2
Q2